

You’re the SharePoint admin or IT manager, someone upstairs wants a BI tool comparison by Friday, and the choice looks straightforward until you start factoring in your actual stack.
Before the comparison, a few things to clear up:
- Data Studio and Google Looker are two completely different products
- This tool went by Looker Studio from 2022 to 2026 before Google renamed it back
- Mixing them up means evaluating the wrong product entirely
The enterprise Looker platform costs $80,000 to $150,000-plus a year, custom-quoted by Google sales. That’s the product earning Google’s Gartner Leader spot, not Data Studio.
For M365 organizations, that mix-up is where the evaluation goes sideways before it even starts. Here’s what I tell clients when they ask me to run this comparison.
What Each Tool Actually Is
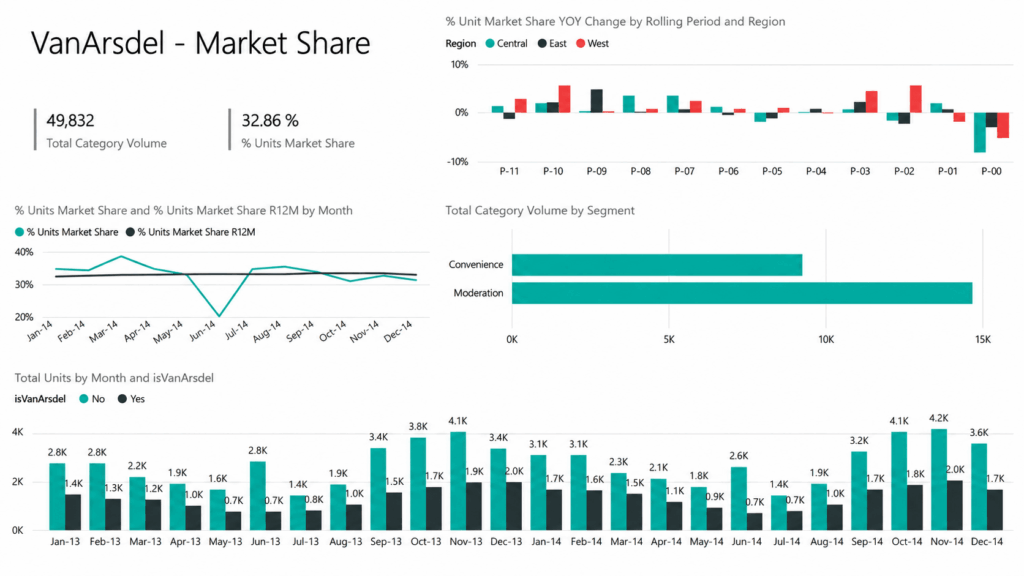
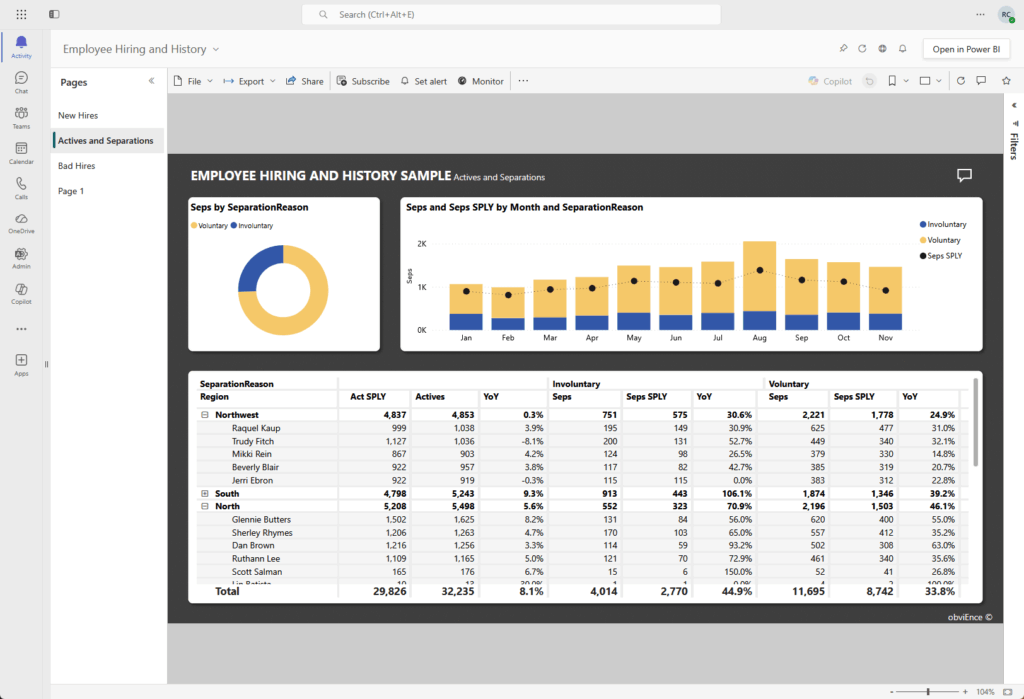
Power BI is Microsoft’s enterprise BI platform. It’s part of Microsoft Fabric, it’s native to Microsoft 365, and it powers serious reporting at scale.
How much scale? It runs reporting for 375,000-plus organizations with 30 million monthly active users as of late 2025.
Data Studio is Google’s free dashboarding tool, formerly called Looker Studio. It’s quick, it’s browser-based, and it’s strong at pulling Google data into a clean report.
Just don’t confuse it with Google Looker, the enterprise platform with LookML. That’s the product that earns Google its Gartner Leader spot.
It plays in a different league: $80,000 to $150,000-plus a year, custom-quoted by Google sales.
So to be clear: this comparison is Data Studio versus Power BI. The enterprise Looker platform is in a different league entirely.
Sign up for exclusive updates, tips, and strategies
Data Connectivity: Where Your Data Already Lives
This is the whole ballgame for M365 orgs. I keep telling clients the same thing: the right BI tool connects natively to where your data already lives.
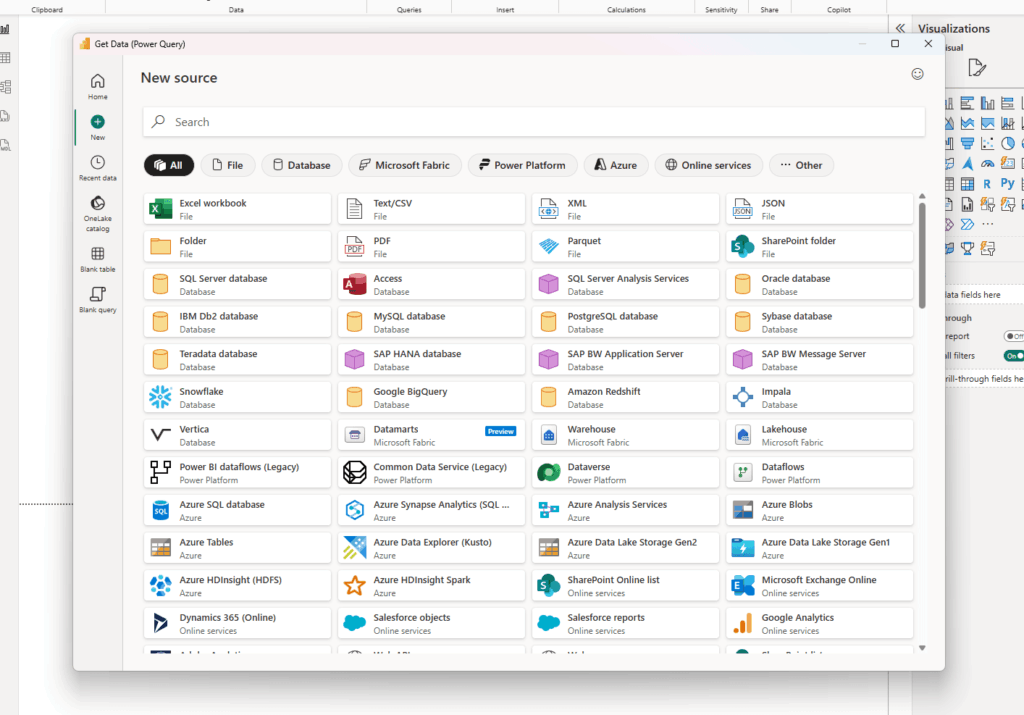
Power BI plugs straight into the Microsoft stack with native connectors. No middleware, no data movement, no monthly toll.
That covers the places your data already sits:
- SharePoint Lists
- Excel Online
- Azure SQL and Azure Synapse
- Dataverse
- OneLake
- Teams
Data Studio connects too. The catch? Its free native connectors are all Google-owned: Analytics, Ads, Search Console, Sheets, BigQuery.
Source: https://learn.microsoft.com/en-us/power-bi/connect-data/desktop-data-sources
Want it talking to SharePoint, Azure, or SQL Server? You’ll need a paid third-party connector, and those add up fast.
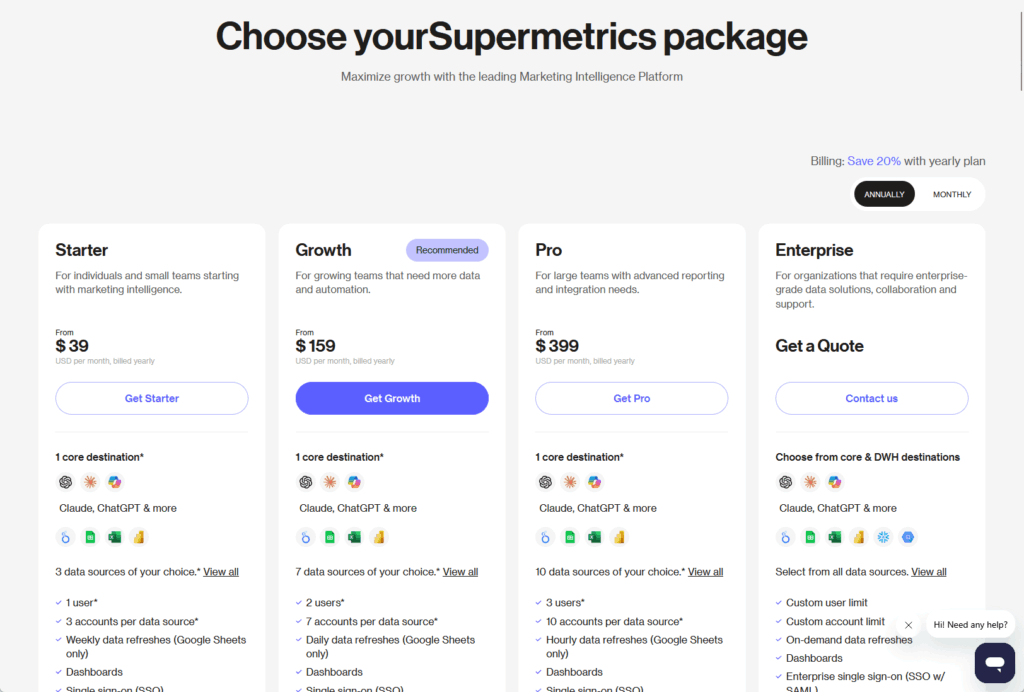
- Supermetrics: $49 to $499/month depending on tier
- Windsor.ai: per-source monthly pricing
- Porter: per-connector monthly pricing
Now run the math the way I run it for clients. “Free” Data Studio plus $200 to $400 a month in third-party connectors climbs fast.
That’s just to reach your SharePoint and Excel data. You end up paying for the platform either way.
Power BI Pro runs $14 per user per month and reaches that same data natively, zero connectors. Once your data lives in M365, the “cheaper” tool usually isn’t.
Source: https://supermetrics.com/pricing
There’s a reason this keeps mattering. The tool that already speaks your stack’s language tends to win.
Pricing and Licensing: What You’re Actually Paying
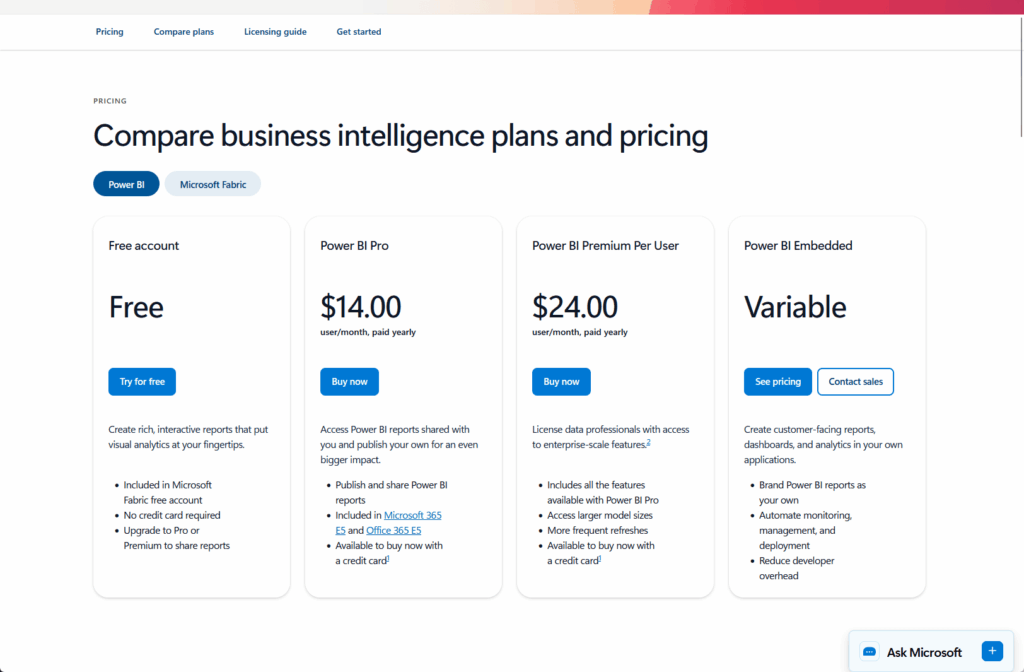
Sticker prices are easy to misread, so let me lay out the real Power BI ladder. Power BI Desktop is free on Windows.
Power BI Pro is $14 per user per month, the first price increase in about a decade when it moved up from $10 in April 2025.
Premium Per User (PPU) sits at $24 per user per month and unlocks the heavier governance and refresh features.
Source: https://www.microsoft.com/en-us/power-platform/products/power-bi/pricing
Here’s the part that trips people up. Power BI Pro is bundled into M365 E5 and O365 E5, but NOT into E3, Business Premium, or anything below.
If you’re on E3, that $14 is a real line item to budget for separately. Data Studio, by contrast, is free with no user limits.
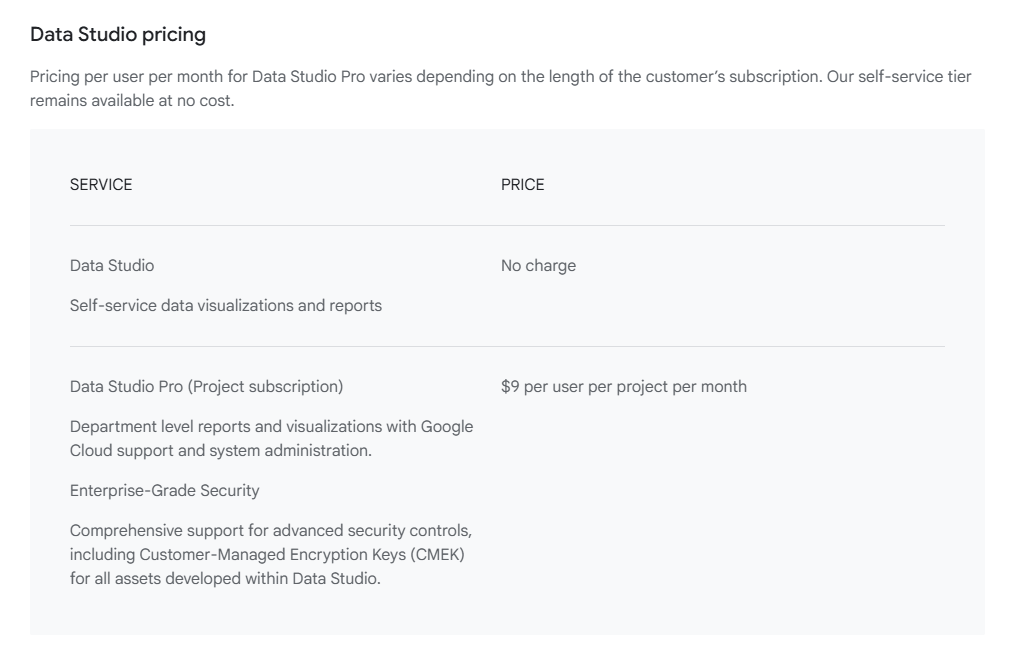
Data Studio Pro runs $9 per user per project per month, and that “per project” wording matters once you scale.
| Tool / Tier | Price | Reaches SharePoint and Excel data? |
|---|---|---|
| Power BI Desktop | Free (Windows) | Yes, natively |
| Power BI Pro | $14/user/month | Yes, natively |
| Power BI PPU | $24/user/month | Yes, natively |
| Data Studio | Free | Only via paid connectors |
| Data Studio Pro | $9/user/project/month | Only via paid connectors |
So the honest cost picture is rarely $14 versus $0. For an M365 org, it’s $14 native versus $0 plus a few hundred a month to bridge the gap.
That’s the comparison I make clients sit with before they get excited about the word “free.”
Governance, Security, and Compliance
This is the part nobody puts on the evaluation scorecard, and it’s the part that bites six months later.
In my experience, governance is where the real cost difference shows up.
Power BI inherits your existing Microsoft 365 controls. Sensitivity labels travel with exports to Excel, PDF, and PowerPoint, flowing downstream from datasets to the reports built on them.
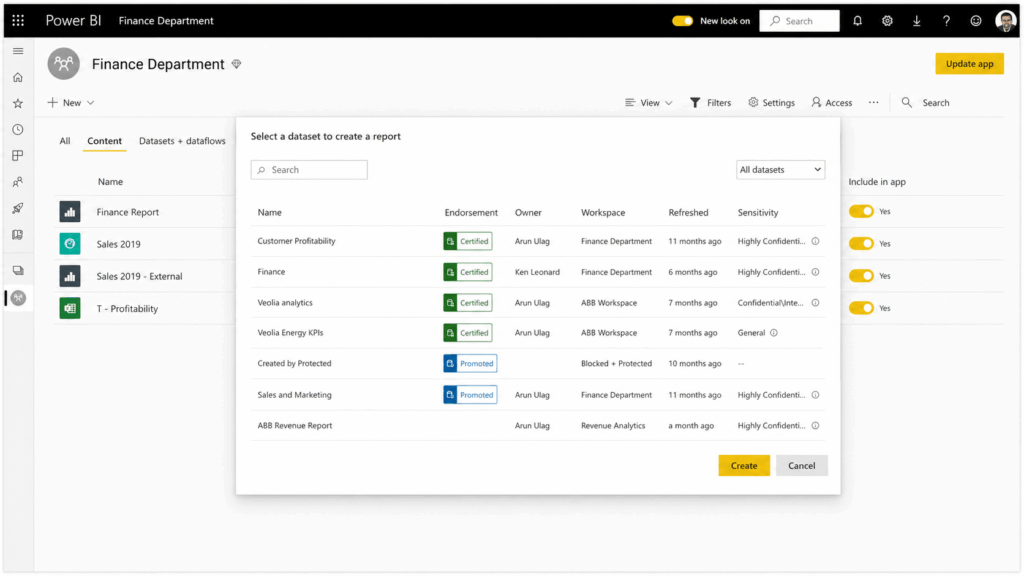
Source: https://learn.microsoft.com/en-us/fabric/enterprise/powerbi/service-security-sensitivity-label-overview
You manage all of it in the M365 admin center. No parallel security model, no second console, no separate team owning a different rulebook.
A couple of caveats worth knowing.
DLP policy enforcement needs Premium licensing (PPU or capacity), and row-level security lets different users see different slices of the same report.
Data Studio is a different story on governance. The free tier has what I call the bus-factor problem: dashboards are owned by an individual Google account.
Person leaves, access can leave with them. I’ve watched teams scramble over a dashboard nobody else could touch.
Source: https://docs.cloud.google.com/data-studio/transfer-ownership
Data Studio Pro fixes that with IAM, SSO, audit logs, and Google Cloud project ownership. Solid features, but they live in a separate security model from M365.
Data Studio has email-based row filtering, but your underlying data needs a viewer email column for it to work, not the model-level role controls Power BI provides.
For an org that’s already invested in M365 governance, Power BI is an extension of what you’ve built. Data Studio asks you to stand up a second one.
This is home turf, and it’s where Power BI becomes genuinely embedded in how SharePoint works. I’ve configured these scenarios more times than I can count.
The everyday integrations look like this:
- Embed a live Power BI report in a SharePoint page with the native web part
- Surface reports inside Teams channels and tabs
- Refresh straight from Excel Online and SharePoint Lists without exporting anything
- Build list-driven reports that update as the list does
Two caveats save you a support ticket later.
Embedding a report in a SharePoint page does NOT auto-grant access. Workspace membership is managed separately, so people still need permission to the underlying report.
And B2B guest users aren’t supported in the SharePoint embed scenario. If external partners need to see it, plan another route.
On freshness, scheduled refresh runs up to 8 times a day on Pro and 48 times a day on Premium. For most SharePoint List dashboards, 8 is plenty.
Source: https://learn.microsoft.com/en-us/power-bi/collaborate-share/service-collaborate-microsoft-teams
Data Studio? No native SharePoint integration. No native Teams integration. If your reporting lives where your team works, that gap is hard to ignore.
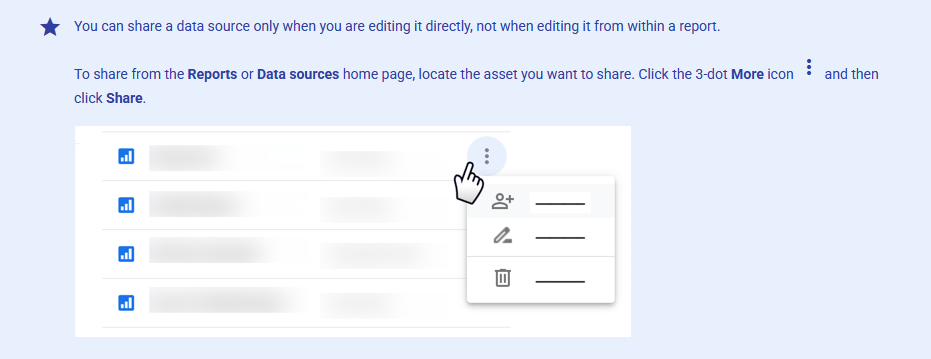
Where Data Studio Genuinely Wins
I’m a SharePoint consultant, so you know my lean. But I won’t pretend Data Studio has no place, because it absolutely does.
Google Analytics, Google Ads, Search Console: this is Data Studio’s natural home. For a marketing team living in Google data, it’s fast, clean, free, and it just works.
That native GA connector ships built-in: no third-party setup, no extra cost. The connector library makes it obvious.
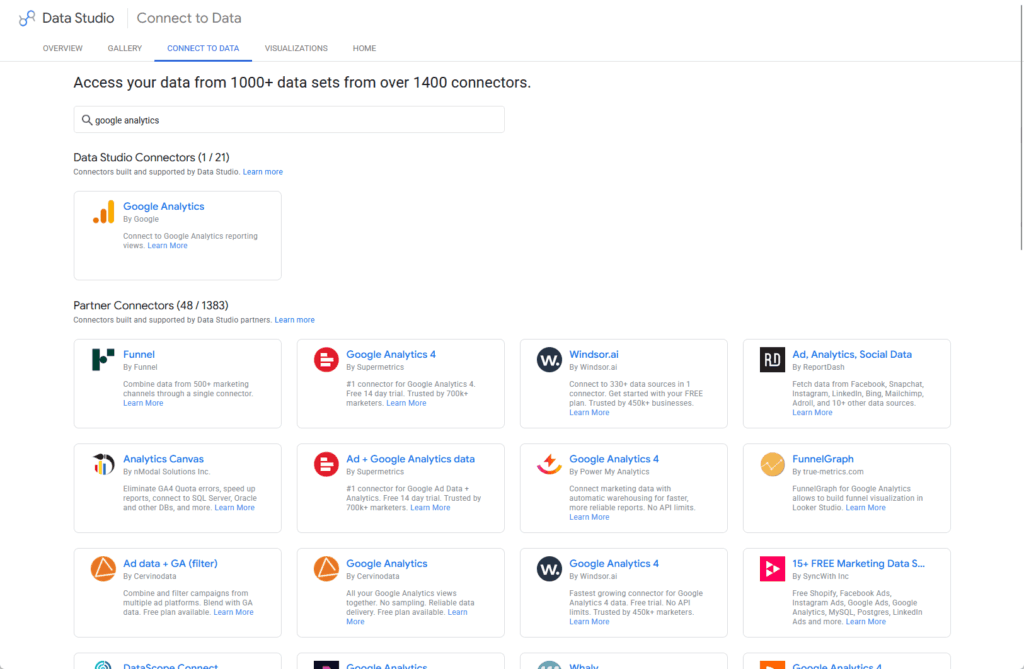
Source: https://datastudio.google.com/data?search=google+analytics
There’s a real-world version of this. Radio-Canada runs multi-source marketing dashboards on Data Studio inside a Google-stack context, and it serves them well.
For a small org with no Microsoft 365 footprint, the choice is obvious. $0 plus native Google connectors beats paying for a platform you’d have to bolt on.
So here’s the honest version. If you’re a Google Workspace shop, not an M365 one, this article’s whole recommendation flips. Use the tool that speaks your stack.
Quick Comparison: Power BI vs Data Studio at a Glance
Here’s the whole thing on one screen:
| Category | Power BI | Data Studio |
|---|---|---|
| M365 native connectors | Built in (SharePoint, Excel, Azure, Dataverse) | None; needs paid connectors |
| Base price | Free Desktop; $14/user/mo Pro | Free; $9/user/project/mo Pro |
| SharePoint embed | Native web part | Not supported |
| Teams integration | Native | Not supported |
| Row-level security | Model-level (full RLS) | Email-based filtering only |
| Governance model | Inherits M365 admin center | Separate model (Google Cloud) |
| Data blending | Strong modeling | Caps at 5 sources; JOIN, no UNION |
| Best for | Microsoft 365 organizations | Google-stack marketing teams |
One table won’t make your decision for you.
But it sorts the field fast, and for most M365 readers the pattern is already clear by the time you reach the bottom row.
Connect Your Stack Before You Choose Your Tool
Pick the tool last, because where your data lives will make the decision for you. For most M365 organizations, the answer becomes obvious once you map the sources.
Here’s what Power BI brings to an M365 environment that Data Studio can’t match:
- Native connectors to SharePoint, Excel, Azure, and Dataverse with no middleware or monthly connector fees
- Governance that extends your existing M365 controls rather than requiring you to build a separate model
- Eighteen years as a Gartner Leader, with 350,000-plus organizations and 30 million monthly users behind it
Save the Children UK started on Data Studio, then moved to Power BI as data complexity grew, saving over £10,000 a year after the switch.
I see that same arc constantly: teams outgrow the free tool right around the moment the data gets interesting and the governance questions start coming in.
So here’s my actual answer when clients ask me this. If you’re on Microsoft 365, Power BI is the tool that already speaks your infrastructure’s language.
Tired of stitching together connectors just to report on data that already lives in SharePoint?
I help Microsoft 365 organizations get Power BI talking to their SharePoint, Excel, and Azure data the way it’s meant to. Reach out and let’s talk.


