

Last Updated on August 18, 2025
Data-driven?
In this guide, let’s talk about how to embed interactive Power BI reports directly into SharePoint.
Let’s get started.
The Modern Way with the Power BI Web Part
For modern SharePoint users, the Power BI web part is the simplest and recommended way to embed reports.
It’s designed for a secure, seamless experience using Single Sign-On (SSO) so users won’t have to log in twice.
Step 1: Getting the Right URL from the Power BI Service
The process starts in the Power BI service, not SharePoint.
You need to generate a special link designed for this integration.
- Publish your report from Power BI Desktop to a workspace in the Power BI service.
- Open the report in your browser (app.powerbi.com).
- Go to the File menu, select Embed report, and then choose the SharePoint Online option.
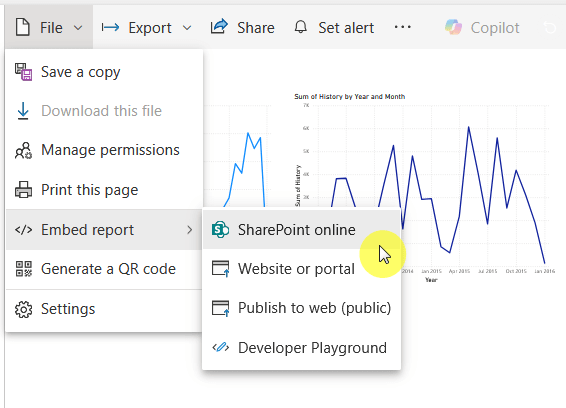
- A dialog box will appear with a unique URL. Copy this link.
It’s critical to use this specific link.
Don’t use the standard URL from your browser, as it will break the seamless sign-on experience.
By the way, if you don’t see the SharePoint option, check your license (must be pro or premium per user).
With the correct URL copied, head over to your SharePoint Online page to add the report.
- Navigate to your SharePoint page and click the Edit button in the top-right corner.
- Hover your mouse where you want to add the report and click the circled ‘+’ icon to open the web part gallery.
- In the search bar, type “Power BI” and select the Power BI web part.

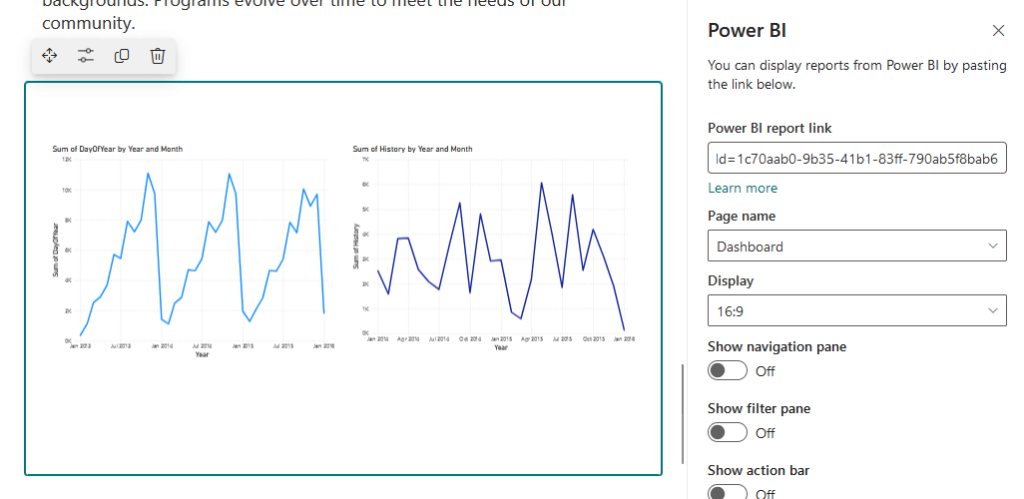
- In the property pane that opens on the right, paste the report link you copied from the Power BI service. The report should load automatically.
Click Publish or Republish to save your changes and make the report visible to your audience.
Step 3: Customizing Display and Interaction Options
The Power BI web part allows for customization of the viewing experience, integrating reports seamlessly into SharePoint.

Here they are:
- Page name: If your report has multiple pages, you can choose which one to display by default.
- Display (Aspect Ratio): The default is 16:9, but changing this to 4:3 often provides a better, broader view of the report content.
- Show Nav Pane: Hiding the page navigation at the bottom is great for embedding a single, focused report page.
- Show Filter Pane: Hide this to simplify the interface if the report is meant to be a static display. Keep it visible if you want to encourage user-driven exploration.
- Show Action Bar: Hiding the action bar (File, Export, Share) creates the cleanest, most integrated look, focusing the user entirely on the data.
Combine these options to curate a specific data experience for your audience, rather than just embedding a report.
This makes the report an integrated component, significantly enhancing usability and driving user adoption.
Bonus: Enabling Copilot for Conversational Insights
You can now embed your report with Microsoft Copilot enabled.
This will allow users to ask questions about the data in natural language directly within SharePoint.
Prerequisites:
- Copilot must be enabled for your organization’s Microsoft 365 tenant.
- The report’s workspace must be hosted on a Power BI Premium or paid Fabric capacity.
To activate it, simply check the Enable Copilot box in the Power BI service when you generate the SharePoint Online embed URL.
Sign up for exclusive updates, tips, and strategies
Method Comparison (Side-by-Side)
While the native Power BI web part is the standard, it’s not the only option.
As you can see here:
| Feature | Embed in SharePoint Online | Secure Embed (iFrame) | Publish to Web (iFrame) |
| Security | Secure / Authenticated | Secure / Authenticated | Public / Insecure |
| Authentication | Single Sign-On (SSO) | Separate Sign-in | None (Anonymous) |
| RLS Support | Yes | Yes | No |
| URL Filter Support | No | Yes | No |
| Viewer License | Pro/PPU or Free (with Premium) | Pro/PPU or Free (with Premium) | None Required |
| Ideal Use Case | Secure internal portals, static dashboards | Secure portals requiring dynamic filtering | Embedding public data on a public website |
This method uses the dedicated “Power BI” web part in modern SharePoint Online.
Pros:
- Seamless Single Sign-On (SSO)
- Fully secure with RLS support
Cons:
- No URL filtering support
- Only for modern SharePoint pages
This provides the best user experience out of the box, making it the top choice for most internal reporting.
Its main drawback is that it lacks context-sensitive dashboards that react to other SharePoint elements.
Option 2: Secure Embed via iFrame (For Dynamic Filtering)
Instead of the Power BI web part, you can use the generic “Embed” web part.
What you put here is the iFrame code generated from the File > Embed report > Website or portal option.
Pros:
- Secure and authenticated
- Supports URL filtering
Cons:
- No SSO (extra sign-in prompts)
- Relies on pop-ups (can be blocked)
This is the go-to workaround when dynamic filtering is a must-have requirement for your dashboard.
Expect a less refined user experience, requiring user instruction for pop-up blockers or extra logins.
Option 3: Publish to Web (The Insecure Public Option)
This method also uses the “Embed” web part.
But with a code generated from the File > Embed report > Publish to web (public) option.
Pros:
- Free for all viewers
- No license or account needed
Cons (Critical):
- Completely insecure and public
- Bypasses all security and RLS
This method should be used with extreme caution and is fundamentally unsuitable for any internal BI.
Its only valid use case is for sharing non-sensitive, public-facing data, such as a report embedded on a company’s public blog.
It’s only suitable for sharing non-sensitive, public data, like a report on a company’s public blog.
For any internal or confidential information, this option must be avoided.
Do you have any questions about embedding Power BI reports in SharePoint? Let me know.
For any business-related queries or concerns, contact me through the contact form. I always reply. 🙂


