

Table of Contents:
Last Updated on August 24, 2025
Tired of sending the same reports every week?
In this guide, I’ll show you how to use Power Automate to schedule and send reports automatically.
Let’s get started.
Create Your Flow with Copilot (The Easy Way)
The quickest way to get started is by letting Copilot, Microsoft’s AI assistant, build the basic flow for you.
You just need to describe what you want in plain English.
How to Use Copilot with a Prompt
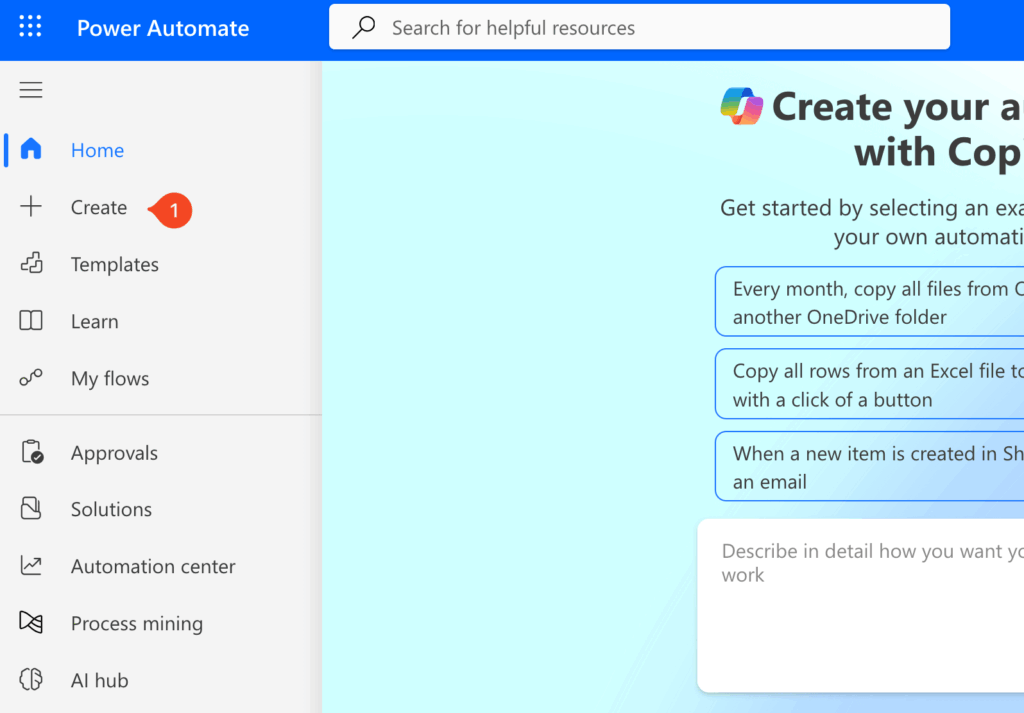
From the Power Automate home screen, find the text box that says “Start building your flow with Copilot.”
Here, you can type out your request.

The key is to be specific about:
- The schedule
- The data source
- What you want to do with it
For example, you could use a prompt like this:
"Every Monday at 9 AM, get items from the SharePoint list named 'Project Tasks' on the 'Marketing Site', and then send a summary email to my manager."
Copilot will interpret this and generate the main steps of the flow for you.
Reviewing and Refining the Flow
Copilot does the heavy lifting, but it doesn’t know every specific detail.
After it generates the flow, you will need to go through each step and fill in the blanks.
- Check the trigger: Make sure the schedule (e.g., “Every Monday at 9 AM”) is correct.
- Configure actions: You will need to select the exact SharePoint site and list, or the specific Excel file and table.
- Finalize the email: Customize the subject line, body, and recipients in the email action.
Think of Copilot as a helpful assistant that builds the frame.
You just need to add the finishing touches.
Sign up for exclusive updates, tips, and strategies
Build a Scheduled Flow from Scratch (The Manual Way)
If you prefer more control or want to understand how everything works, you can build the flow from the ground up.
The process starts with a special kind of trigger that runs on a schedule.
The “Recurrence” Trigger
The foundation of any scheduled report is the Recurrence trigger.
This tells your flow when to run.
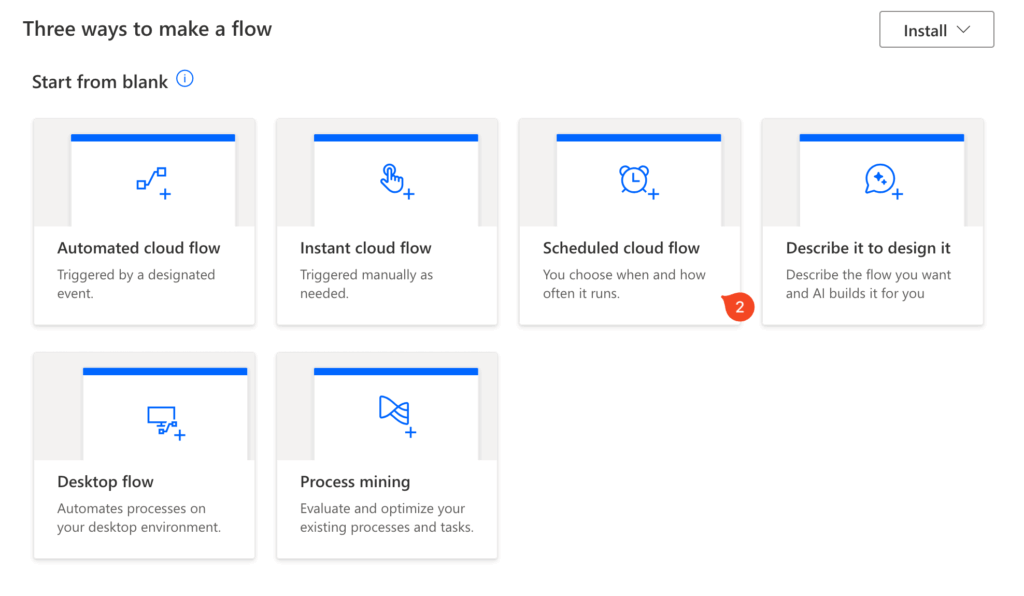
- From the Power Automate portal, click Create on the left menu.
- Select Scheduled cloud flow.
- Give your flow a name, set a start date, and choose how often you want it to repeat (e.g., every 1 week, every 1 day).

This sets up a blank flow that will run on the schedule you defined.
Essential Settings for Reliability
To make sure your report runs exactly when you expect it to, there are a few advanced options you should always configure.
| Setting | Description | Why It’s Important |
| Time Zone | The specific time zone for your schedule. | Power Automate’s servers run on UTC time. Setting your local time zone prevents your flow from running at the wrong hour, especially when daylight saving time changes occur. |
| Start Time | The exact date and time for the flow’s first run. | This gives you precise control over when the automation begins. |
| On these days | Lets you pick specific days of the week. | Useful for reports that only need to run on weekdays or on a specific day, like the first Monday of the month. |
Excel spreadsheets and SharePoint lists are common places to store business data.
Power Automate can easily pull information from them and format it into a clean, readable report.
Preparing Your Data Source
Before you build the flow, make sure your data is ready.
- For Excel: Format your data as an Excel Table and save the file in OneDrive or SharePoint.
- For SharePoint: No special formatting is needed for SharePoint lists.
Taking a moment to prepare your data source is a crucial first step.
It ensures that Power Automate can find and read your information without any issues, making the rest of the process much smoother.
You can also use Copilot to kickstart this process.
Try a prompt that specifies the file and what you want to do with it.
For example:
"Every Friday at 4 PM, get the data from the 'SalesData' table in the Excel file 'Q3-Sales.xlsx' located in my OneDrive, and email it as a table to the sales team."
Building the Flow: From Data to Email
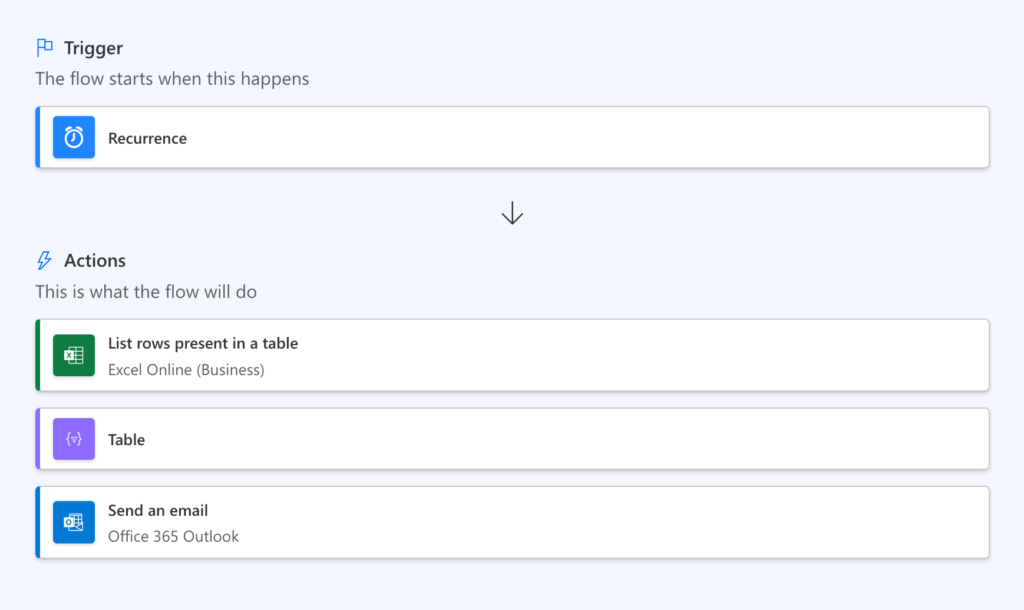
For those who prefer to build the flow from scratch, the process involves a few key steps that pull your data, style it, and send it.
First, you need to get the data.
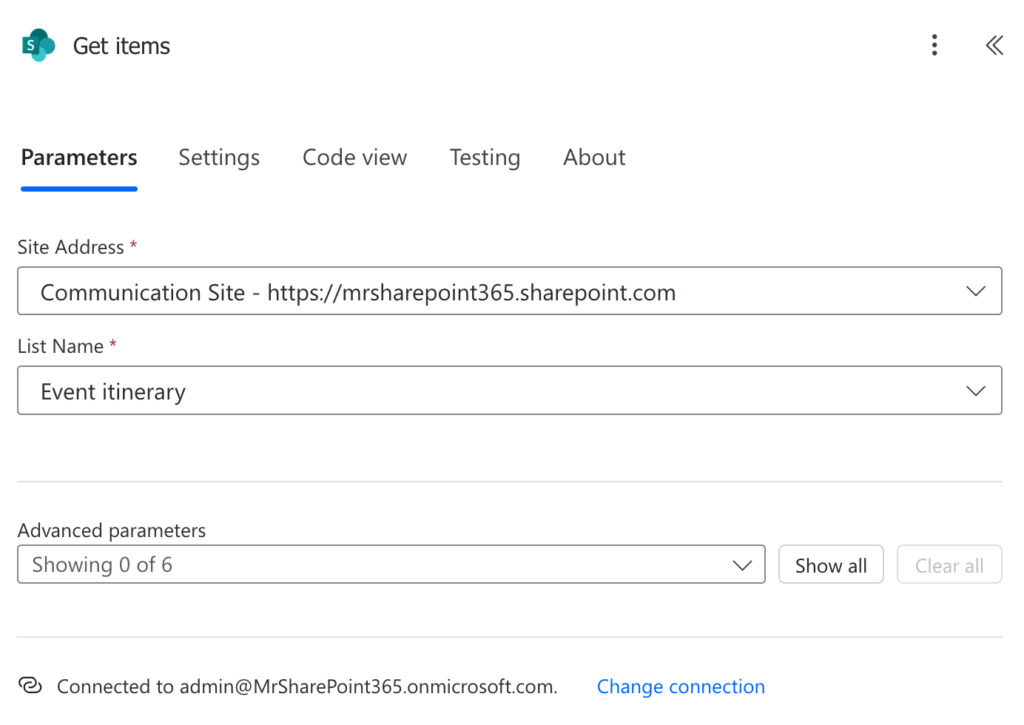
Add an action to your flow and use “List rows present in a table” for Excel or “Get items” for SharePoint.
Make sure to point it to your specific file or list.
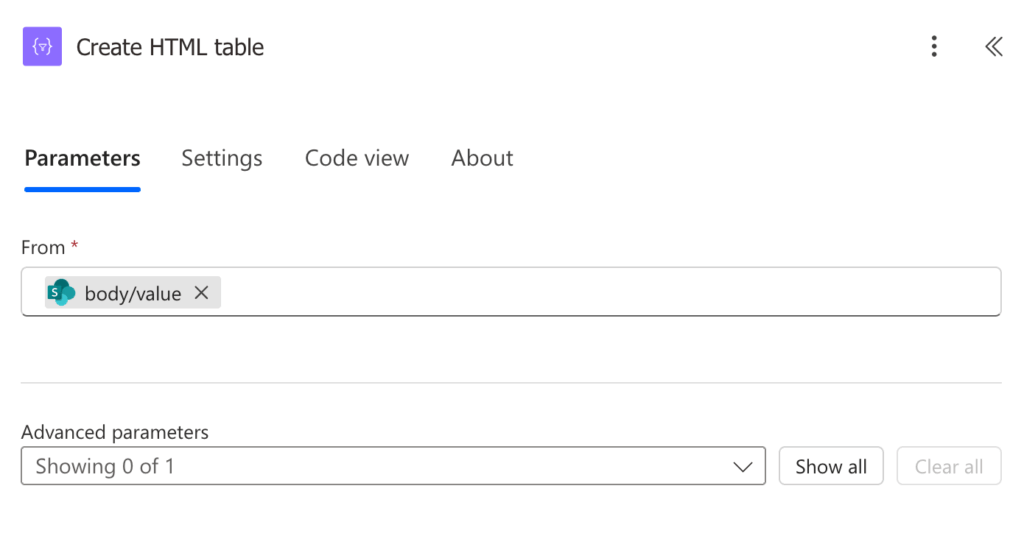
Next, add the “Create HTML table” action.
Use the data from the previous step as its input to convert your rows and columns into an HTML structure.
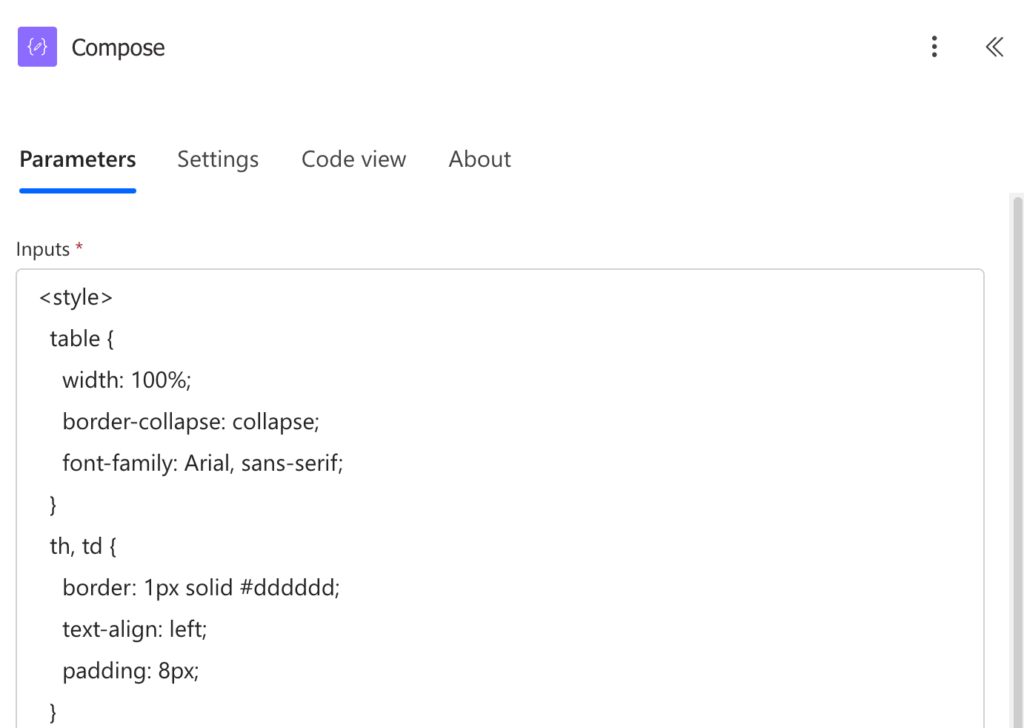
Since the default table is plain, you can add a “Compose” action.
This will paste in some CSS code for styling the table’s borders, header color, and row padding.
Finally, use the “Send an email (V2)” action.
In the email body, place the output from your CSS action first, followed by the output from the HTML table action.
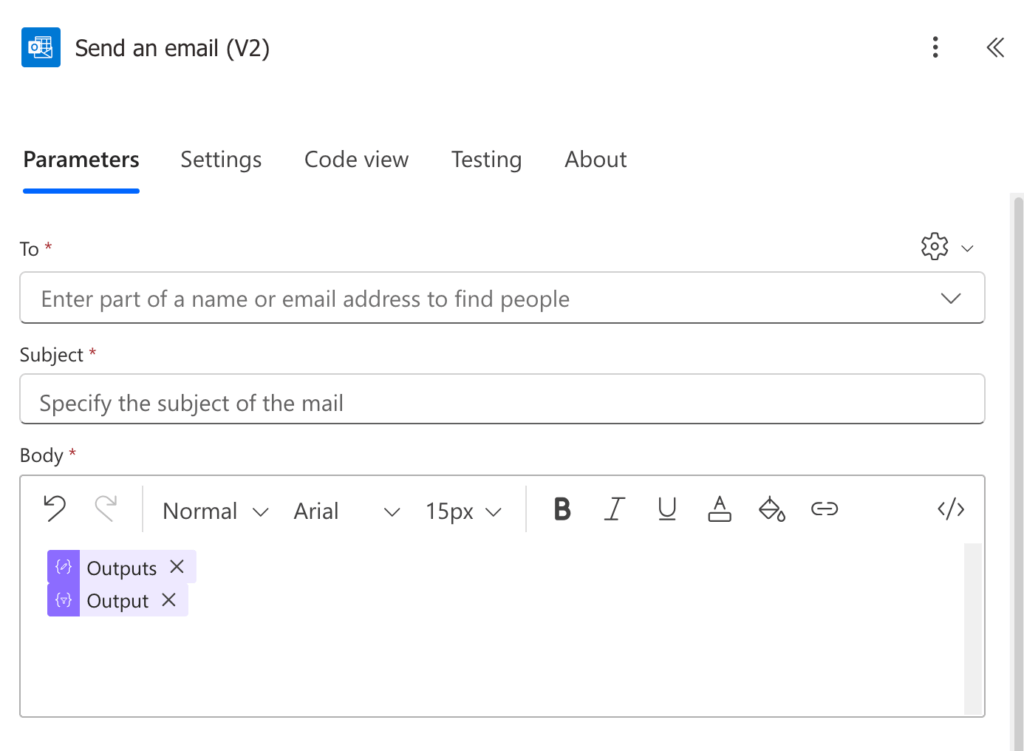
Remember to click the </> icon to switch to Code View.
That’s an important step that ensures Outlook displays the styled table correctly instead of just showing raw code.
Method 2: Distributing Power BI Reports
For more visual, data-rich reports, you can automate the distribution of Power BI views.
This method has a few more requirements but is powerful for sharing insights with stakeholders.
Key Prerequisites
Before you start, make sure you have the following in place:
- Power BI Capacity: The report you want to send must be in a workspace that has a Power BI Premium or Fabric capacity. This is a paid tier of Power BI.
- Power Automate License: The action used to export Power BI reports is a premium connector, which means you need a Power Automate Premium license.
- Permissions: You need to have the necessary permissions within the Power BI service to access and share the report.
Using Copilot for Power BI Reports
You can use Copilot to generate the initial steps for this automation.
Be sure to specify the report and the desired format in your prompt.
For example:
"On the first day of every month, export the Power BI report named 'Monthly Financials' as a PDF and email it to the finance department."
Assembling the Automation
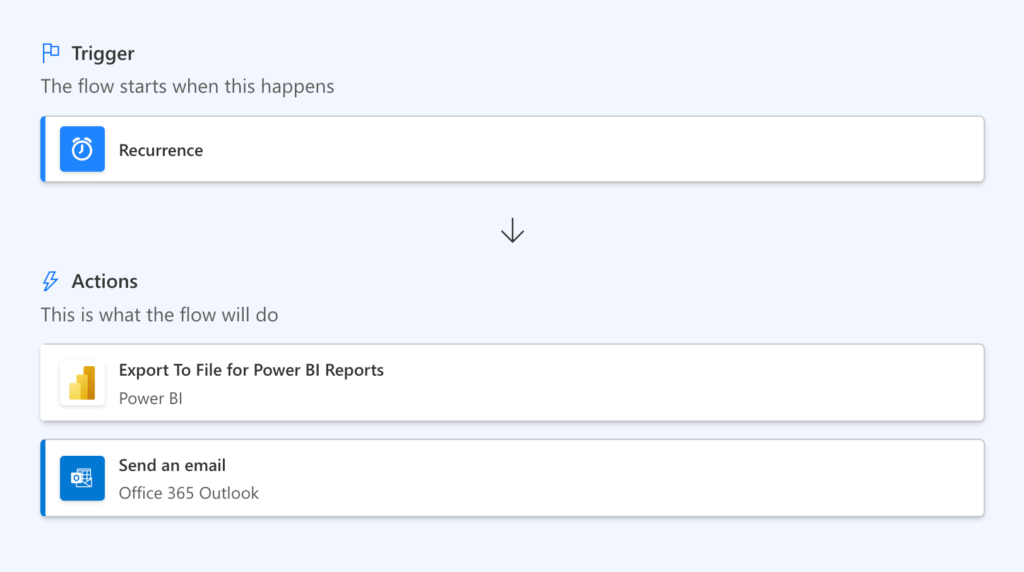
The flow itself is quite straightforward.
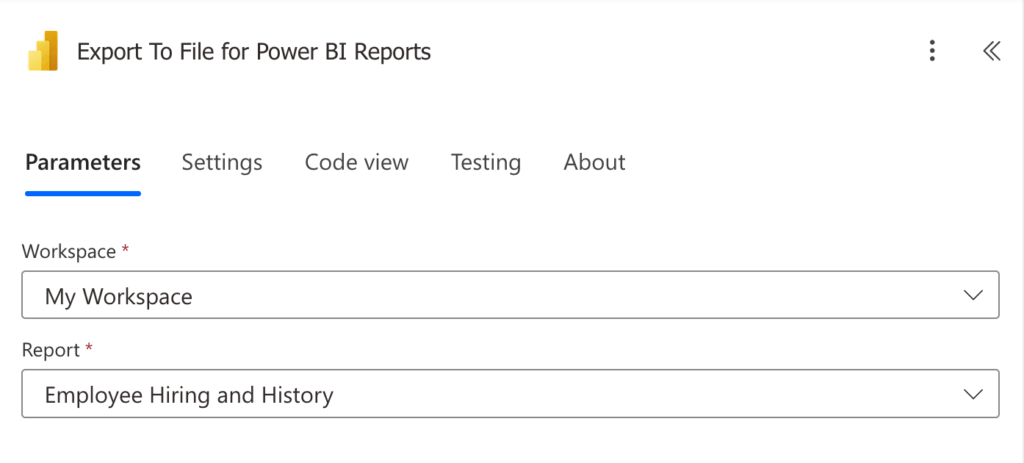
After the recurrence trigger, your first step is to add the “Export To File for Power BI Reports” action.
In this action, you will select the correct Workspace, Report, and the Export Format you want, such as PDF or PPTX.
Once the report is exported, the next step is to email it.
Add the “Send an email (V2)” action.
In the attachments section, give the file a descriptive name like “Weekly Sales Report.pdf”.
Then use the File Content output from the export action as the attachment content.
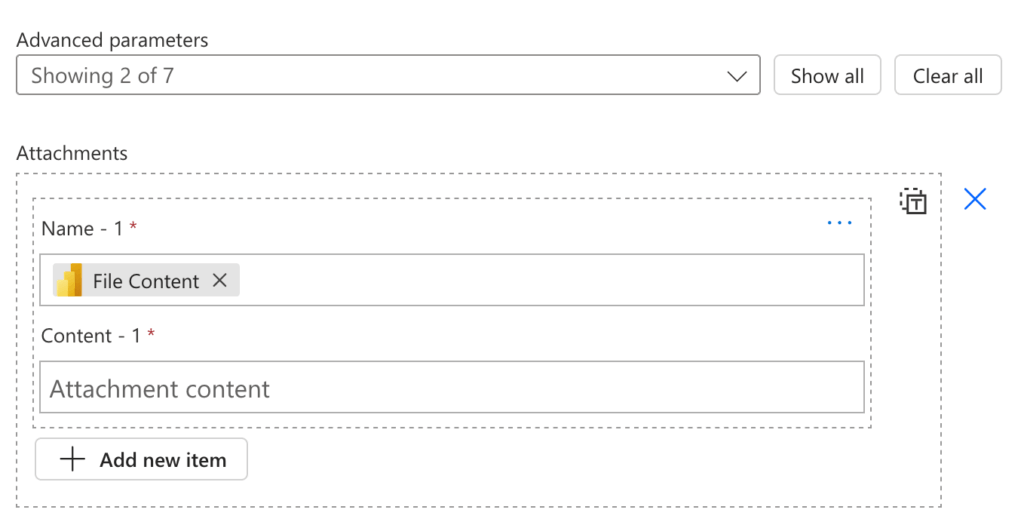
This will dynamically attach the newly created report file to your email.
Method 3: Automating Reports from SQL Server
If your company’s data is stored in a SQL Server database, you can query it directly to create reports from the source of truth.
Connecting to a SQL Database
Connecting to SQL requires a couple of key components:
- Premium License: Like Power BI, the SQL Server connector is a premium feature, so it requires a Power Automate Premium license.
- On-Premises Data Gateway: If your SQL Server is located on your company’s private network (and not in the cloud, like Azure SQL), you will need to have an on-premises data gateway installed.
Note that this gateway acts as a secure bridge between Power Automate in the cloud and your local data.
Using Copilot for SQL Server Reports
To get a head start with Copilot, provide a prompt that clearly states the server, database, and what you want to do with the data.
For example:
"Every day at 8 AM, run a query against the 'Orders' database on the 'ProdSQL' server to get new orders, and email the results to the fulfillment team."
Building the Reporting Flow
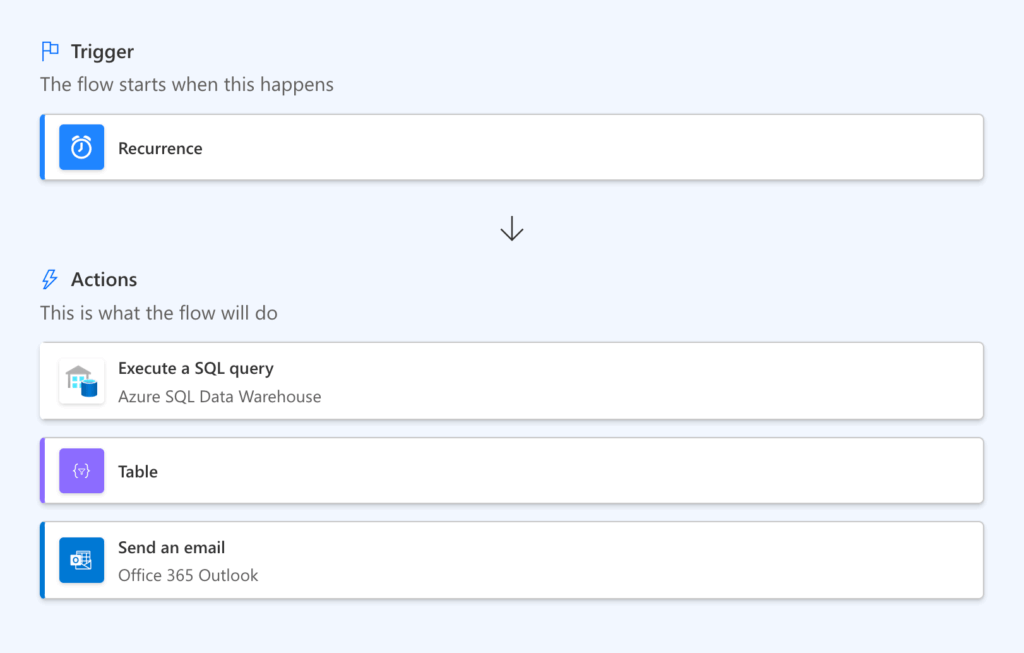
The flow follows a similar pattern to the Excel/SharePoint method.
You will start with the recurrence trigger to set the schedule for your report.
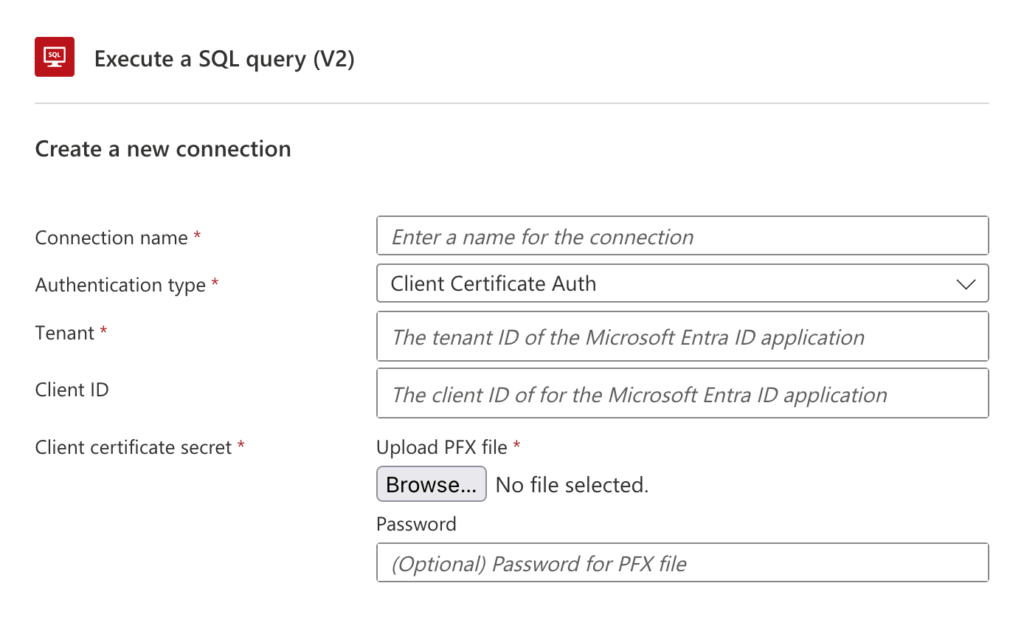
Next, add the “Execute a SQL query (V2)” action.
Here, you will select your SQL server connection and write the specific SQL query needed to retrieve the data for your report.
After getting the data, use the output from the query as the input for the “Create HTML table” action.
Finally, you can add your CSS styling and configure the “Send an email (V2)” action, just as you did in the first method. 🙂
Start Automating Your Reports
Automating your reports with Power Automate can free you from tedious, manual work, freeing up your time.
Whether you start with a simple prompt in Copilot or build a flow from scratch, you can connect to your data wherever it lives.
It won’t matter if it’s in an Excel file, a Power BI dashboard, or a SQL database.
Do you have questions about scheduling reports in Power Automate? Let me know in the comments.
For any business-related queries or concerns, contact me through the contact form. I always reply. 🙂


